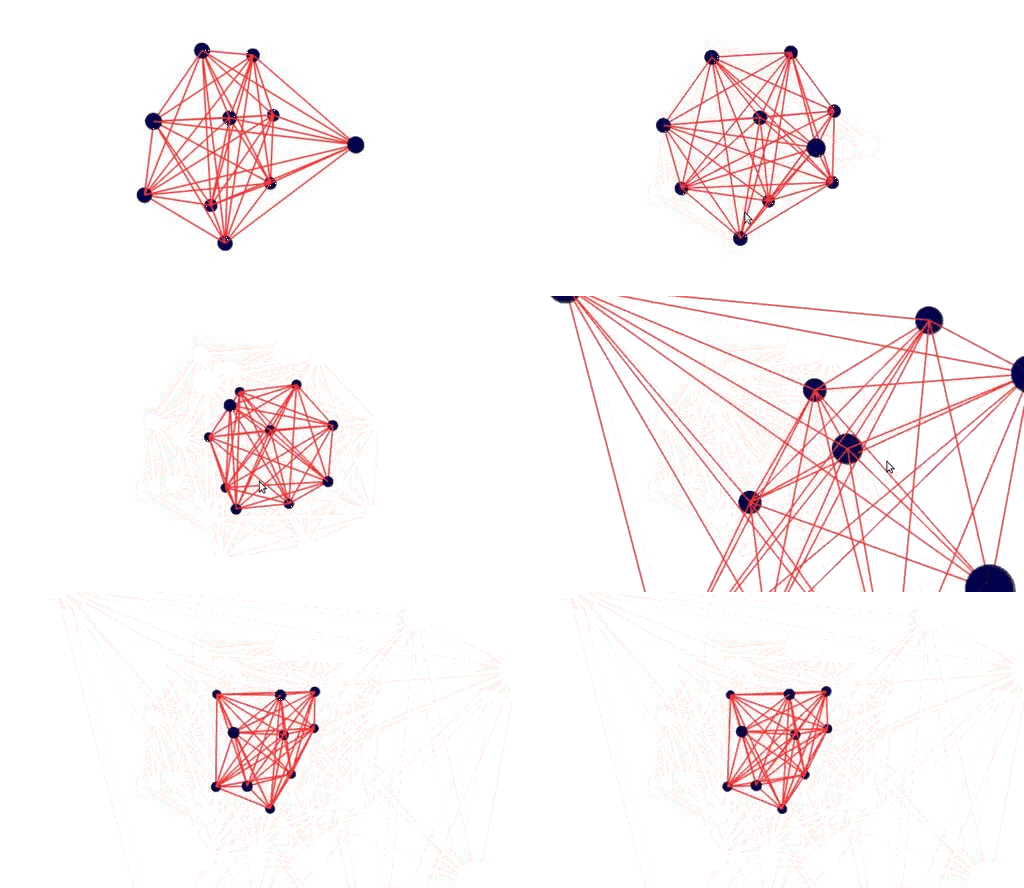
A Julia module to render graphs in 3D using ThreeJS tightly coupled with LightGraphs.
In a Julia REPL, run:
Pkg.add("NetworkViz")The NodeProperty type stores the properties of each node in the graph. It stores the following properties :
color: It is aColorsarray that stores the colors of all the nodes in the graph.size: Size of the node. eg :0.2.shape: Shape of the node. Can be 0 or 1.0 - Square,1 - Circle.
The EdgeProperty type stores the properties of each edge in the graph. It stores the following properties :
color: It is a hex string that stores the color of the edges.width: Thickness of the edges. eg :1.5.
The drawGraph function can be used to draw the graphs in 2D or 3D with nodes having different colors. It can accept LightGraphs.Graph and LightGraphs.Digraph types. drawGraph can be used to draw graphs from adjacency matrices also. The function accepts an additional kwargs node::NodeProperty, edge::EdgeProperty, and z. If z=1, it draws a 3D graph. If z=0, a 2D visualization of the graph is drawn. node and edge determines the properties of nodes and edges respectively.
Usage :
g = CompleteGraph(10)
c = Color[parse(Colorant,"#00004d") for i in 1:nv(g)]
n = NodeProperty(c,0.2,0)
e = EdgeProperty("#ff3333",1)
drawGraph(g,node=n,edge=e,z=1) #Draw using a Graph object (3D).

am = full(adjacency_matrix(g))
drawGraph(am,node=n,edge=e,z=0) #Draw using an adjacency matrix (2D).

dgraph = bfs_tree(g,1)
drawGraph(dgraph,z=1) #Draw a Digraph.addEdge(g::Graph,node1::Int,node2::Int,z=1)- Add a new edgenode1-node2and redraws the graph.ztoggles 2D-3D conversion. Fails silently if an already existing node is added again.removeEdge(g::Graph,node1::Int,node2::Int,z=1)- Removes the edgenode1-node2if it exists and redraws the graph.ztoggles 2D-3D conversion.addNode(g::Graph,z=1)- Adds a new node to the graph.ztoggles 2D-3D conversion.removeNode(g::Graph,node::Int,z=1)- Removesnodeif it exists and redraws the graph.ztoggles 2D-3D conversion.
#Run this code in Escher
using NetworkViz
using LightGraphs
main(window) = begin
  push!(window.assets, "widgets")
  push!(window.assets,("ThreeJS","threejs"))
  g = CompleteGraph(10)
  drawGraph(g)
end
The above code produces the following output :
Here is another example with a code-mirror where functions can be typed in. Depending on the LightGraphs function used, 2D as well as 3D graphs are drawn. You can see the working demo here.
You can find many other examples in the examples/ folder.
IainNZ for the original Spring-Embedder code. (Taken from GraphLayout.jl).
